
Thursday, 11 June, 2026г.


Где искать: по сайтам Запорожской области, статьи, видео ролики
пример: покупка автомобиля в Запорожье
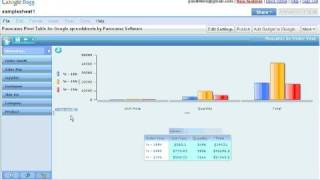
How to Analyze Demographic Data with Pivot Tables
 У вашего броузера проблема в совместимости с HTML5
Pivot tables are the fastest, easiest way to make sense of spreadsheets. In this video, I show you how to use pivot tables to quickly tally demographic data -- how many people are in the spreadsheet, how many males and females are included, and so on.
-----
Purchase the spreadsheet and handout used in this video ($5): https://gum.co/CDbfK
-----
Soar beyond the dusty shelf report with my free 7-day course: https://depictdatastudio.teachable.com/p/soar-beyond-the-dusty-shelf-report-in-7-days/ Most "professional" reports are too long, dense, and jargony. Transform your reports with my course. You'll never look at reports the same way again.
Теги:
pivot tables Excel Microsoft Excel easy analysis easy Excel tricks tips strategies demographic data tallying spreadsheets analyzing data homework help report how many people Ann K. Emery research evaluation nonprofit
Похожие видео


Мой аккаунт