
Thursday, 04 June, 2026г.


Где искать: по сайтам Запорожской области, статьи, видео ролики
пример: покупка автомобиля в Запорожье
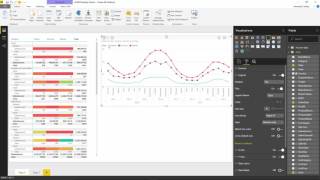
The Power KPI visual for key performance indicator with supporting information
 У вашего броузера проблема в совместимости с HTML5
The Power KPI visual is for presenting a key performance indicator (KPI) along with a variety of supporting information, including:
Title, Subtitle
Current date and KPI status (value, indicator symbol, variance)
Line chart with KPI trend, forecast line, and other comparison lines, as well as tooltips
https://store.office.com/en-us/app.aspx?assetid=WA104381083&productgroup=PowerBI&ui=en-US&rs=en-US&ad=US&homprd=PowerBI&sourcecorrid=0607c01b-b445-4751-a9c9-d0aeeb640f00&homappcat=KPIs&homapppos=2&homchv=1&appredirect=false
More questions? Try asking the Power BI Community @ https://community.powerbi.com/
Updated 7/24/2017
Теги:
Power BI PowerBI Business Intelligence Business Analytics Analytics data business data Microsoft custom visual
Похожие видео

Мой аккаунт